Highlight

Successful together – our valantic Team.
Meet the people who bring passion and accountability to driving success at valantic.
Get to know usThis website is also available in your language.
About
Highlight

Successful together – our valantic Team.
Meet the people who bring passion and accountability to driving success at valantic.
Get to know usAbout
Highlight

Successful together – our valantic Team.
Meet the people who bring passion and accountability to driving success at valantic.
Get to know usOur mission: Digital excellence for our customers.
With in-depth know-how, clear values, and a vibrant corporate culture, we shape digital transformations that make a real impact.
Careers
Careers
Highlight

Female Digital Impact
Women are increasingly shaping the IT industry – at valantic, we create opportunities together and promote talent so that diversity becomes a strength.
Turn your vision into realityCareers
Highlight

Female Digital Impact
Women are increasingly shaping the IT industry – at valantic, we create opportunities together and promote talent so that diversity becomes a strength.
Turn your vision into realityCareers at valantic – making a difference together.
Are you looking for a professional environment with challenging digital projects for renowned clients? You're in the right place.
misurio AG designs and develops the cloud-based IoT platform energyON to make energy suppliers’ energy systems more flexible.
misurio AG, headquartered in Visp, develops software solutions that are part of the cleantech sector. Its core competencies are simulations in virtual power plants and mathematical optimizations for energy management. The company builds virtual power plants from flexible energy systems and develops the appropriate business models for these plants. misurio also operates a virtual power plant as an energy provider.


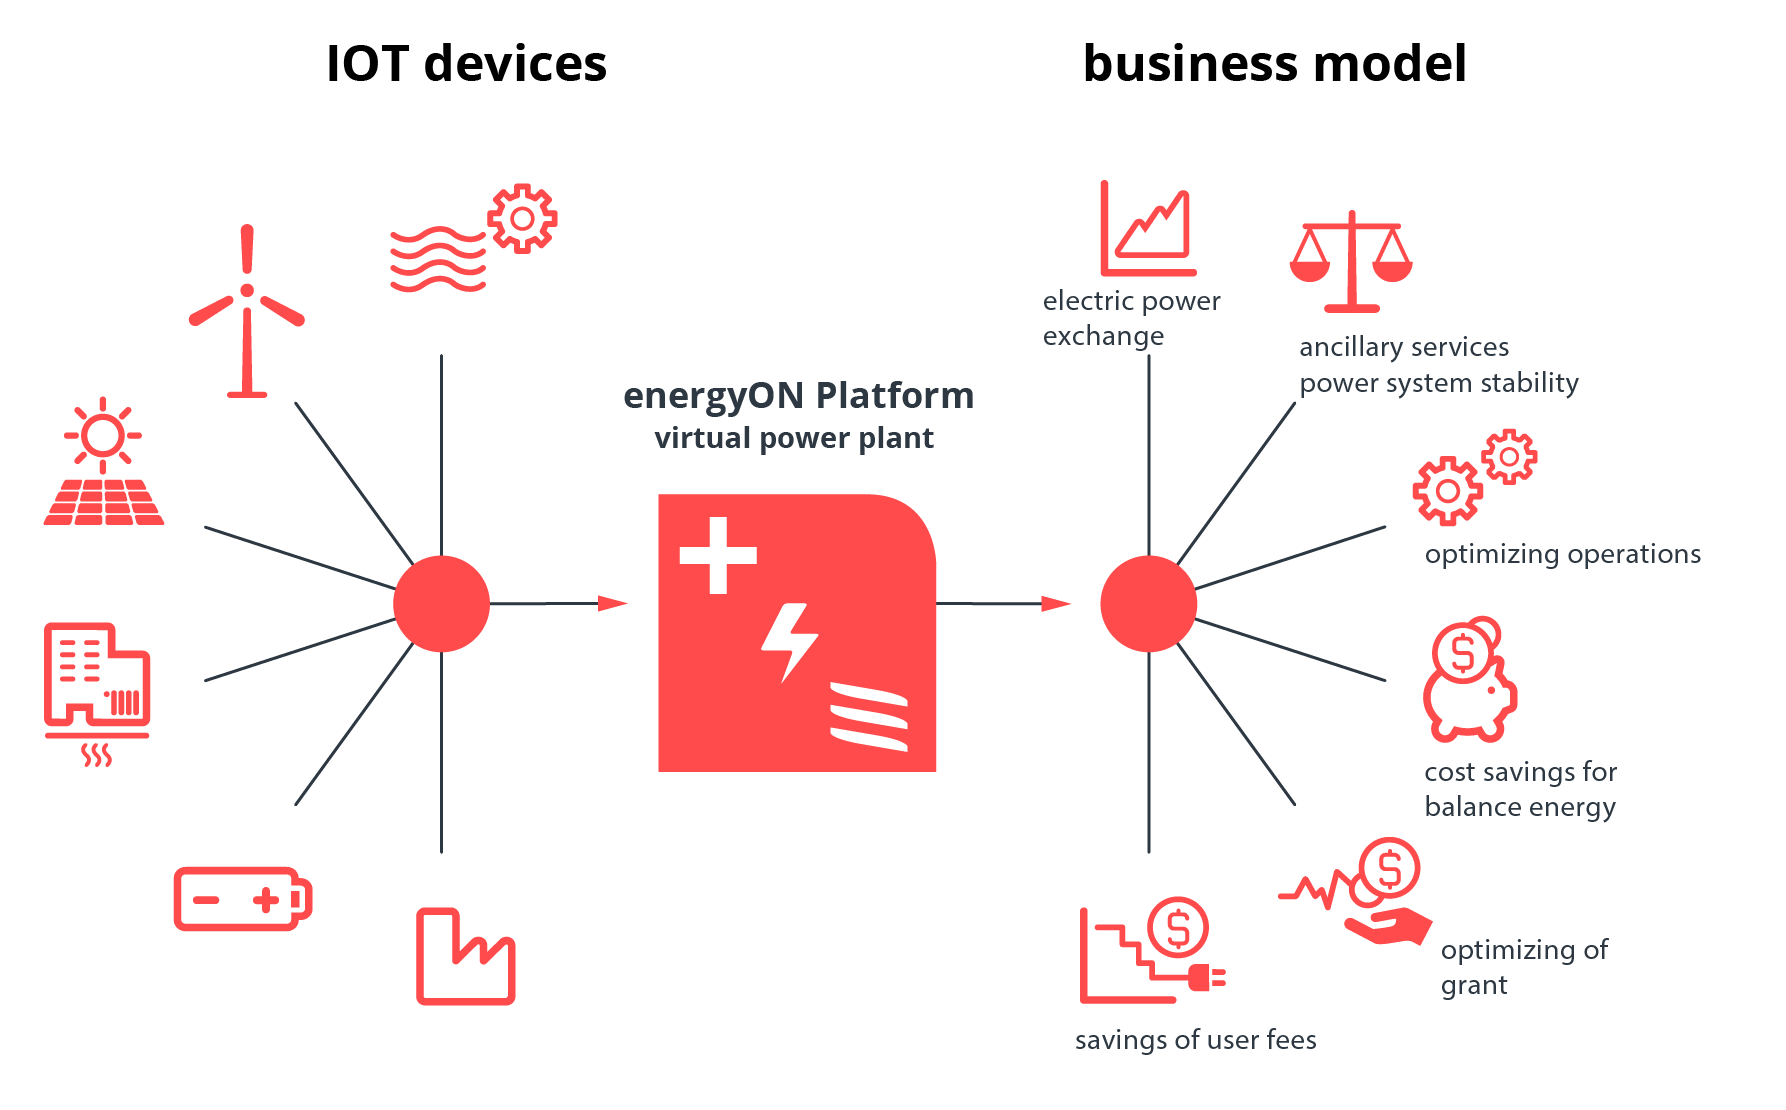
The energyON platform is a virtual power plant. Flexible loads and production capacities are networked and managed in a pool so that costs are reduced and additional revenue is generated for all participants, such as energy providers, industrial facilities, and power plant operators.
In advance of the project, we advised on and assisted with the target architecture of the EnergyOn platform. The relationship continued with support for the development of the company’s own application. Here, in the first step, we developed the graphic display of a simulation. The simulation visualizes how changes in supply affect output. This visualization is supposed to help decision-makers plan their resource distribution.
The project team consisted of developers, architects, and a project manager. All of them have many years’ experience in the development and design of complex JEE applications and they therefore took on this exciting task with great enthusiasm and élan.
Development was done based on the IBM IOC/IOW platform, that is, essentially based on IBM WebSphere using JavaEE.
The IBM product Intelligent Operations for Water (IOW) is software for data management, visualization, and user interaction in order to evaluate quantities of data from a wide variety of units, resources, systems, and participating actors and transform the results into reliable information.
The OEM version of IOW is integrated into the EnergyOn platform.
We approached the project in an agile manner. The definition of sprints enabled us to distribute the work flexibly across the team and to react to current developments. A “burndown chart” visualized a forecast of whether work yet to be done could be performed by the target date in question. The implementation state of the individual work packages and of technical project progress was therefore transparent at all times.
Dr. Karl Werlen
CEO misurio AG
”The valantic team won us over with its great expertise, outstanding quality, and obvious commitment. The team implemented our extremely complex requirements with joy and commitment. The quality of the results is outstanding and our cooperation was open and trusting. We would be happy to work with valantic again in the future.“
